AiM ENVIRONMENTAL SYSTEMS
Video guide

INDEPENDENT LAB · DEVICE + JOURNAL + PENCIL

What if the otters disappeared?

  1. Explore
  2. Learn
  3. Test
  4. Explain
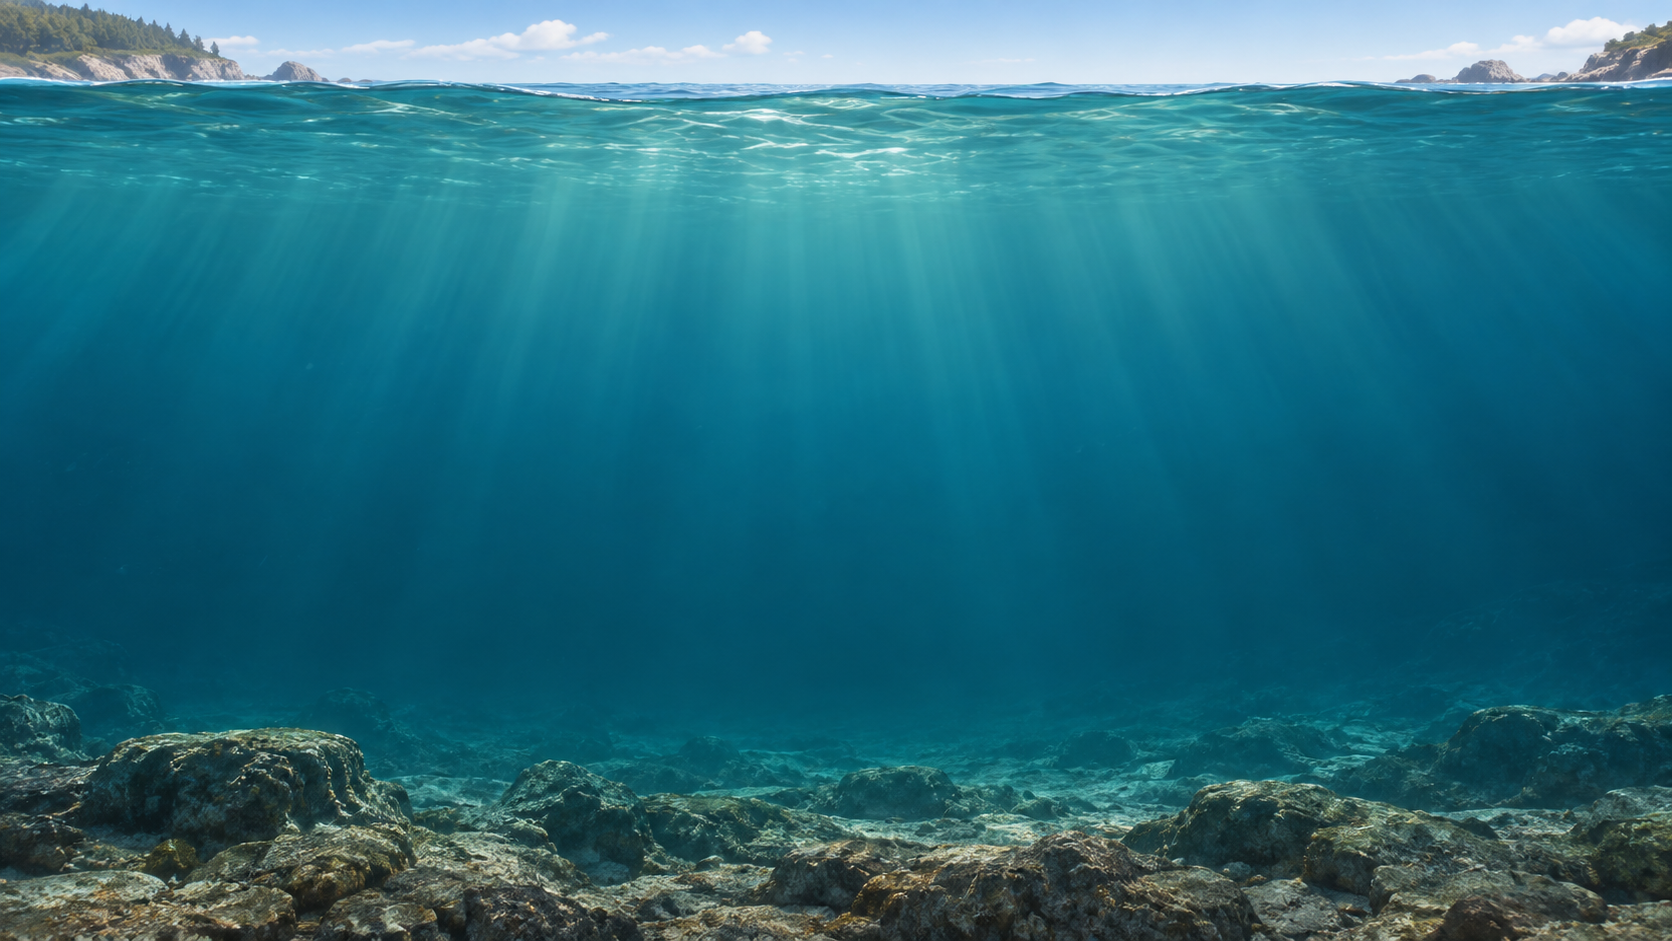
Scientific illustration of coastal water above a rocky seafloor Explore the forest
Click an organism to inspect it.AI-created illustration · symbols show trends, not actual counts

This is a simplified classroom model. Real ecosystems have more connections.

Science source and model limits

This qualitative model illustrates one possible otter–urchin–kelp chain reaction. It is not a measured experiment, numerical simulation, or forecast. More or fewer drawings show a trend, not a population count. The time-step buttons advance ecological time; no exact number of days or years is implied.

Otters eat urchins; urchins eat kelp. Otter loss can allow more grazing and less kelp. Returning otters may help kelp recover when other conditions are suitable, but recovery is not immediate or guaranteed. Warming, disease, alternate prey, and other factors are omitted. Fish populations are not simulated. Science background: NOAA aquatic food webs.

The ocean and movable organisms are AI-created realistic illustrations, not field photographs. Close-up photographs are National Park Service images reused from the previous lessons; sea otter photo: NPS/Jim Pfeiffenberger. Written work stays in your journal. Progress and choices are saved in this tab for refreshes, with no name or student information. Completion is a self-check, not an automatically submitted grade.
LOOK CLOSELY

Add your own observation to your journal.

SELF-PACED · FULL LESSON CYCLE

You can complete this on your own.

Follow the activity from beginning to end. Use your device, composition journal, and pencil. No printing, partner, live demonstration, or teacher explanation is required.

Suggested pacing: 45 minutes. These are guides, not countdowns. Take the time you need, reread instructions, and use Go back. All writing stays in your journal; buttons are only for interacting and checking your thinking.

  1. 0–5 · Explore: inspect the organisms. Record 3 things noticed, 2 interesting things, and 1 question.
  2. 5–7 · Reflect: connect one observation to visible evidence. This individual reflection takes the place of a class discussion.
  3. 7–10 · Fab 5: read the five vocabulary cards; write brief meanings and a sentence connecting two terms.
  4. 10–12 · Purpose and prediction: identify the investigation’s purpose and predict what might happen.
  5. 12–14 · Tool walkthrough: practice the close-up controls and set up your observation rows.
  6. 14–25 · Guided investigation: follow the on-screen prompts to remove otters, observe changes, and restore otters. Hints and feedback replace a teacher-led demonstration.
  7. 25–35 · Labeled drawing: compare two forests and draw their organisms and feeding connections.
  8. 35–42 · Independent analysis: answer three questions in your journal before opening each self-check.
  9. 42–45 · Conclusion and closure: explain the evidence, check your prediction, revisit your opening question, and check your completed report.

Your six journal sections: 1. Exploration, purpose, and prediction; 2. Vocabulary; 3. Procedure and observations; 4. Labeled drawing; 5. Analysis; 6. Conclusion.

Use your own observations and wording. The completion screen is a self-check, not an automatically submitted grade. Keep your journal for your teacher to review.